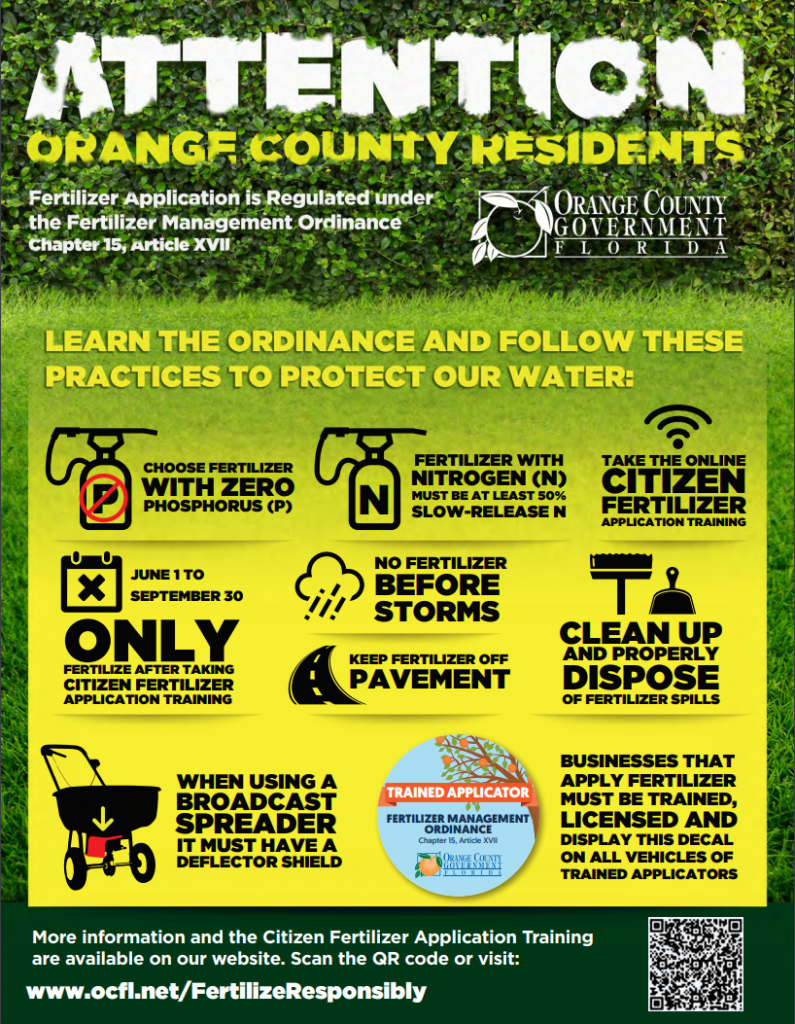
June 6, 2019
Removal of Lakefront Vegetation
John Schmidt
Background
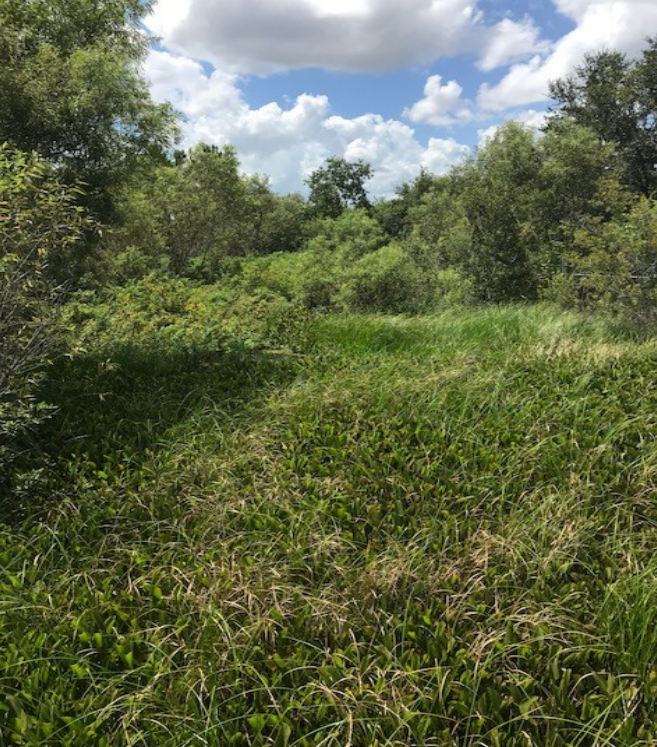
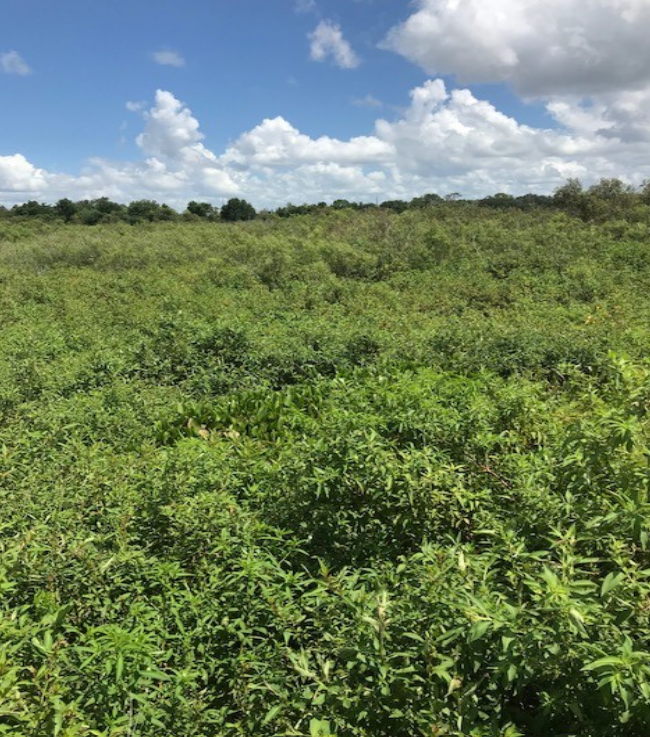
As many lakefront homeowners already know, adding, removing or modifying the vegetation along the shoreline of Johns Lake is regulated by the state of Florida. These activities are monitored through a permitting process as part of the ”Florida Aquatic Plant Management Act” and the “Florida Aquatic Weed Control Act”, both are administered by the Florida Wildlife Commission (FWC).
A few definitions are in order:
- “Aquatic plant” means any plant, including a floating, immersed, submersed, or shorefront species, growing in, or closely associated with, an aquatic environment, and includes any part or seed of such plant.
- “Aquatic plant management” means an activity designed to control the growth of aquatic plants so as to protect human health, safety and recreation and, to the greatest degree practicable, to prevent injury to non-target plants, animal life, and property.
Removal of harmful/invasive plant life is encouraged but it must be done properly and in most cases replanting of eco-friendly vegetation in place of the plants removed is required. This is necessary to strike a balance between allowing lakefront residents to enjoy the benefits of a nice, aquatic environment along their shoreline while maintaining healthy standards for appropriate foliage around Johns Lake in general. Part of the conditions of issuing a permit may be the requirement to replant specific vegetation to support a healthy lakefront.
Florida law requires all persons to obtain a permit from FWC prior to controlling, removing or altering aquatic plants in waters of the state unless the waters or activities are expressly exempt from the permitting requirements.
Exemptions
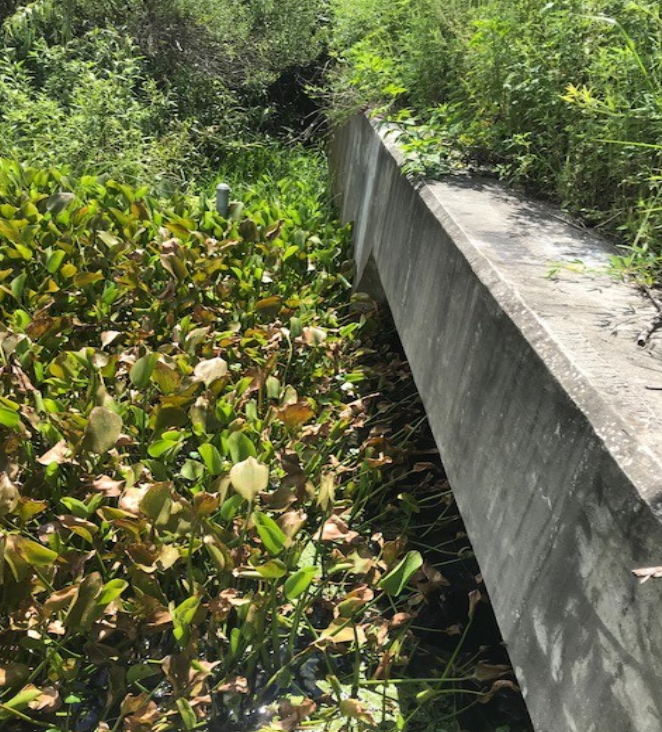
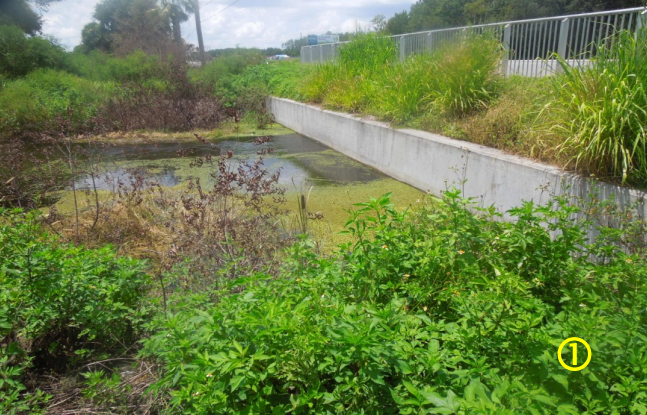
Permits are not required for waterfront owners seeking to remove non-woody vegetation and shrub species from fresh water bodies by physical or mechanical means along 50 feet or 50% of the shoreline (whichever is less) in order to allow open water access for boats or swimmers.
This exemption does not apply to “Aquatic Preserves” or “Outstanding Florida Waters” locations.
Purpose
With a permit you can remove exotics which will allow room for native plants to grow and expand. This ensures that you have a plan for managing your waterfront that will not harm the water body and help protect the investment you have made in it. The work can be done through physical or mechanical means. Removal by herbicides also requires a permit.
Proper management of the shoreline will also:
- Enhance aesthetics
- Improve food and habitat for fish and wildlife
- Provide erosion control and soil stabilization
- Ensure plants are present for nutrient uptake which will result in cleaner water
How to Obtain a Permit
Obtaining the right permit(s) can be challenging, depending on where a homeowner resides on Johns Lake. A State FWC permit is required, a county permit may also be required as well as a city permit in some cases. Here are some guidelines but a homeowner should confirm and adhere to the latest requirements of his/her locale – (checking government web sites is one way to do this):
Orange County:
- You are required to obtain a state FWC “Aquatic Plant Management Permit (its free and easy to fill out the online forms)
- If you live in Orange County, but outside the city of Winter Garden (Oakland for instance), in addition to the FWC permit, the homeowner should obtain an Orange County “Clearance of Shoreline Vegetation Permit”
- If you live in Orange County, in the city of Winter Garden, in addition to the FWC permit, the homeowner should obtain the Winter Garden “Shoreline Alteration Permit”. Note that this permit negates the requirement for the Orange County permit but not the FWC permit.
Lake County:
- Lake County has no local permitting requirement. The FWC permit process for management of aquatic plants is all that is required.
- If you live in Clermont (within Lake County), there are no special permits required. The FWC permit suffices for homeowner aquatic plant management activities.
In the case of multiple levels of permits, the homeowner must comply with the permit with the strictest requirements.
For the sake of brevity the general requirements of the individual permits will not be covered here and the homeowner must read and carefully adhere to the mandates.
For instance, Orange County requires that a permit applicant contact adjacent property owners to make sure there are no objections to the lakefront activities covered by the permit – this can be done by a “No Objection” form filled out by the neighbors. Winter Garden permits require a Homeowner’s Association letter of approval if the property lies within an HOA managed subdivision. The point being that the homeowner should not assume that the general requirements of one permit automatically satisfy another.
In addition, any of the permit issuing agencies may reach out to the homeowner for further information on the project. The agency may make suggestions or alterations to the project, inspect the results of the project when completed and even take enforcement action if a project has failed to adhere to the permit guidelines.
Permit Assistance and Resources
Florida Wildlife Commission:
Obtaining an FWC permit is a relatively simple process and is free.
- Those homeowners wanting to fill out a permit online need to first register as a user on their website.
- Click on the text “Register New User” to the right of the User ID box.
If additional help is needed with the application it can be obtained by contacting Sharon Stinson at Sharon.Stinson@myfwc.com or by calling 863-534-7074. An existing permit can be easily renewed through the same method.
Orange County:
If the property lies in Orange County the permitting falls under the auspices of the EPD (Environmental Protection Division) and the permit application can be downloaded and filled out for submission. It is called a “Lakeshore Vegetation Removal Permit”. There is a $126 fee for this permit and it can be mailed in or delivered in person to the EPD. Details concerning application, submission and requirements are on their website.
For additional information the homeowner can contact:
Environment Protection Department
3165 McCrory Place, Suite 200
Orlando, FL 32803
Email: EPD@ocfl.net
Phone: (407) 836-1400
City of Winter Garden:
For the City of Winter Garden permits a homeowner can visit the government office in downtown Winter Garden (300 W. Plant St, Winter Garden, FL 34787) or call the city (407-656-4111) or download the permit application online.
Responsibilities
With a permit you can remove exotics which will allow room for native plants to grow and expand. This ensures that you have a plan for managing your waterfront that will not harm the water body and help protect the investment you have made in it. The work can be done through physical or mechanical means. Removal by herbicides also requires a permit.
Additional Considerations
- If a lakefront construction project (seawall, dock, etc.) in any County or City includes, modifications to Johns Lake aquatic vegetation then a Saint Johns Water Management District ERP (Environmental Resource Permit) may also be required.
More information is available at: https://www.sjrwmd.com/permitting/#about-erps - If a lakefront aquatic management plan will involve the removal of large growth vegetation, such as trees, the homeowner must contact the state Department of Environmental Protection in addition to the other permit requirements above. This may be done through the following contact:

Conclusion
Through the permitting process, lakefront owners can insure they are in compliance with the various government guidelines and that the aquatic plant management they are requesting is appropriate and beneficial for the lake and the resident. Proceeding without proper permitting is a code violation and could result in serious fines, delaying of the project or having to correct work that was done improperly which will result in significant costs to the homeowner. A government agency could require a remediation plan for the homeowner to correct discrepancies.
Let’s all work together to ensure that Johns Lake continues to be clean and enjoyable for many decades!